Saturday, July 5, 2008


Unstandardized Choropleth Map: The data used in making the map is just the total data and not areally averaged.

Standardized Choropleth Map: A choropleth map that has been areally averaged. The information is not just a total value (e.g. number of people in a state ) but standardized to some unit, usually area (e.g. people per square mile).

Univariate Choropleth Map: A choropleth map in which only one variable is illustrated.


Bivariate Choropleth Map: A choropleth map in which two variables are distinquished. In this case, Democrat and Republican.

Friday, July 4, 2008


Unclassed Choropleth Map: A choropleth map in which the data is continuous. There are as many intervals as there are areal units.


Classed Choropleth Map: The data is grouped within areas such as states and counties, shaded according to value. Areal units are combined into a smaller number of units classified as intervals. There are typically four to seven units of classification. Units may be classified according to equal steps, natural breaks, minimum variance, or quantile.

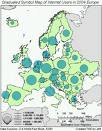
Range Graded Proportional Circle Map: Range graded proportional circle map: a proportional circle map that depicts the data in relation to ranges of data. The information is classified as equal quantiles, breaks, natural breaks, and minimum variance. . Range-graded scaling: The data are divided into groups, using classification procedures common to choropleth mapping. The design goal is for symbol size discrimination, rather than magnitude estimation. The cartographer chooses symbol sizes for adjacent classes so that the map reader can easily distinguish between circle sizes, and therefore, categories. Only a set number of circle sizes are used.